Quantitative and Qualitative data:
Quantitative data: is data that is based on facts and figures.e.g. 'the pebble had a volume of 4cm cubed'
Qualitative data: is data that is based of of opinions. E.G. 'on this map i can see that there are a lot of hills in this area'
Primary and Secondary data:
Primary data: is original data collected by yourself first hand. E.G. 'we went to the beach and collected
data on the size of pebbles at different points.'
Secondary data: easily sourced of of the internet, data that you didn't collect yourself. "I went on to GCSE Bitesize and copied the answers."
stratified data: A transect is a line following a route along which a survey or observations are made. The transect is an important geographic tool for studying changes in human and/or physical characteristics from one place to another.
field trip: we collected our data by using many different equipments for instance the little gun like thing that allowed us to tell what the angle was on the coast line
Stratified data:
when talking about this sort of data we look at how the population can be divided into different groups or segments, and each group sampled using a systematic approach. the group of people who fit into the certain category should be to the same percent as in the parent population.
when talking about this sort of data we look at how the population can be divided into different groups or segments, and each group sampled using a systematic approach. the group of people who fit into the certain category should be to the same percent as in the parent population.
Random data:
>is having a random group of people not specified to type. E.G. "there were 10 people in my set."
>Least biased of all sampling techniques, there is no subjectivity - each member of the total population has an equal chance of being selected.
>Can be obtained using random number tables.
>Microsoft Excel has a function to produce random number.
Samples are chosen in a systematic, or regular way.
>They are evenly/regularly distributed in a spatial context, for example every two meters along a transect line
>They can be at equal/regular intervals in a temporal context, for example every half hour or at set times of the day
>They can be regularly numbered, for example every 10th meter or after 3 rocks over 20Cm cubed
Transects:
A transect is a line following a route along which a survey or observations are made. The transect is an important geographic tool for studying changes in human and/or physical characteristics from one place to another.
A transect is a line following a route along which a survey or observations are made. The transect is an important geographic tool for studying changes in human and/or physical characteristics from one place to another.
To- mark the angle of the beach we used a gun clinometer and we move up the beach every 3 meters and then check the angle again.
We used a measuring tape to measure a Dirty line across the width of the beach. secondly, we marked out ,at three meter intervals, the place we were to place our quadrat. finally we chose a pebble from every corner of the quadrat and measured their height, width and depth with a caliper. Then used a measuring jug to calculate the volume. We also used a gun clinometer.
to begin with we used a measuring tape to measure a line across the width of the beach, so that we could work out how many meters up the beach we would be going (18 meters). Next, at three meter intervals we placed down our quadrat and chose a four pebbles from inside the quadrat and measured the width, height and depth with a caliper. finally using a measuring jug we worked out the volume of each pebble. Another test we did involved the gun clinometer which measured the angle of the beach for every three meters we have our data in a graph
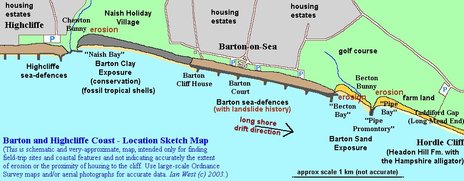
Highcliffe applied field work:
null Hypothesis:
Long shore drift doesn't move from west to east
our null hypothesis was correct.
Long shore drift doesn't move from west to east
our null hypothesis was correct.
Sphere of influence:
for our school the sphere of influence would be the catchment area. The way that we could check on who comes from where, is by having a questionnaire and having a grouped data of every so many miles radius and also by using the postcode, finally we would also have to ask what year they are in, or if they are a member of staff.
